Insurance
Know which policies sit in the flood before the first claim is filed, and settle the straightforward ones without sending an adjuster.
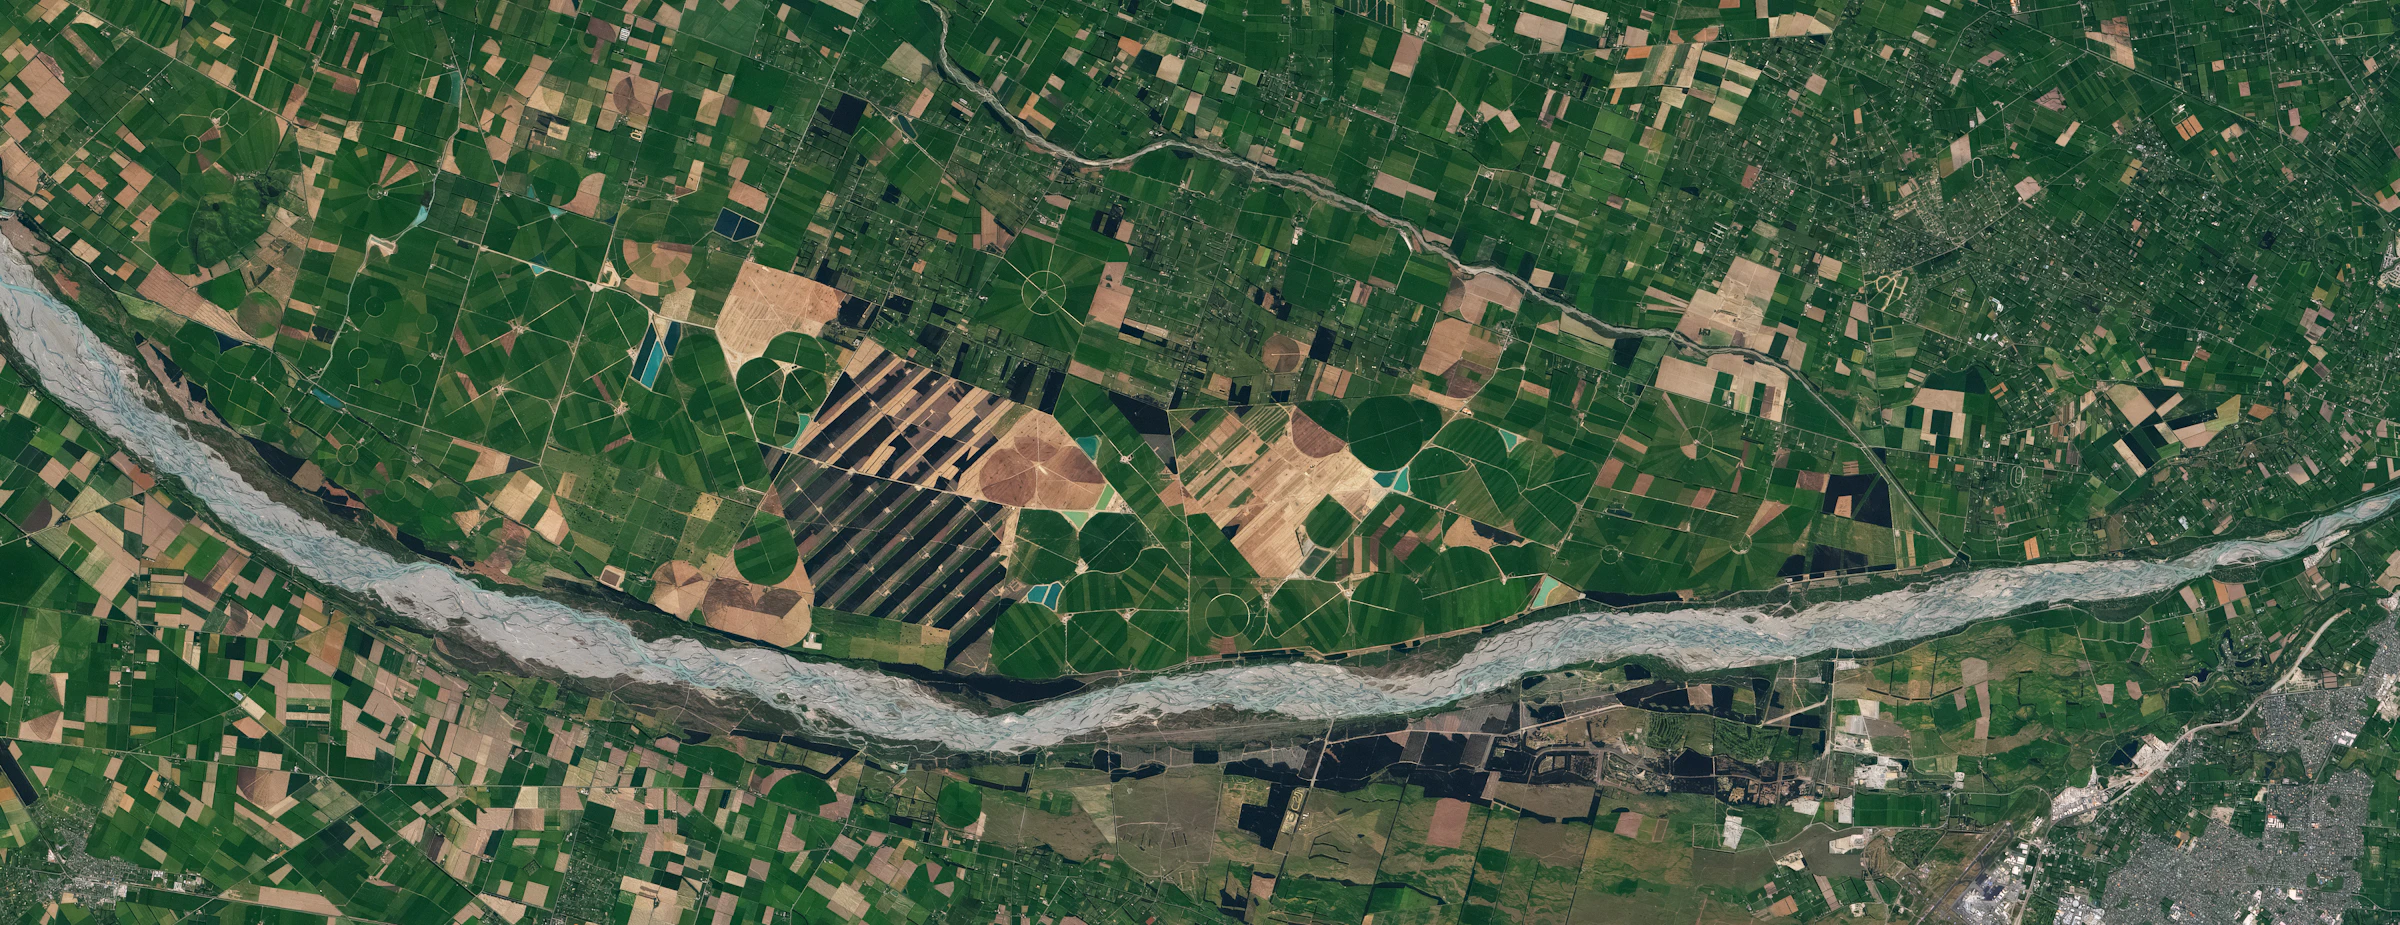
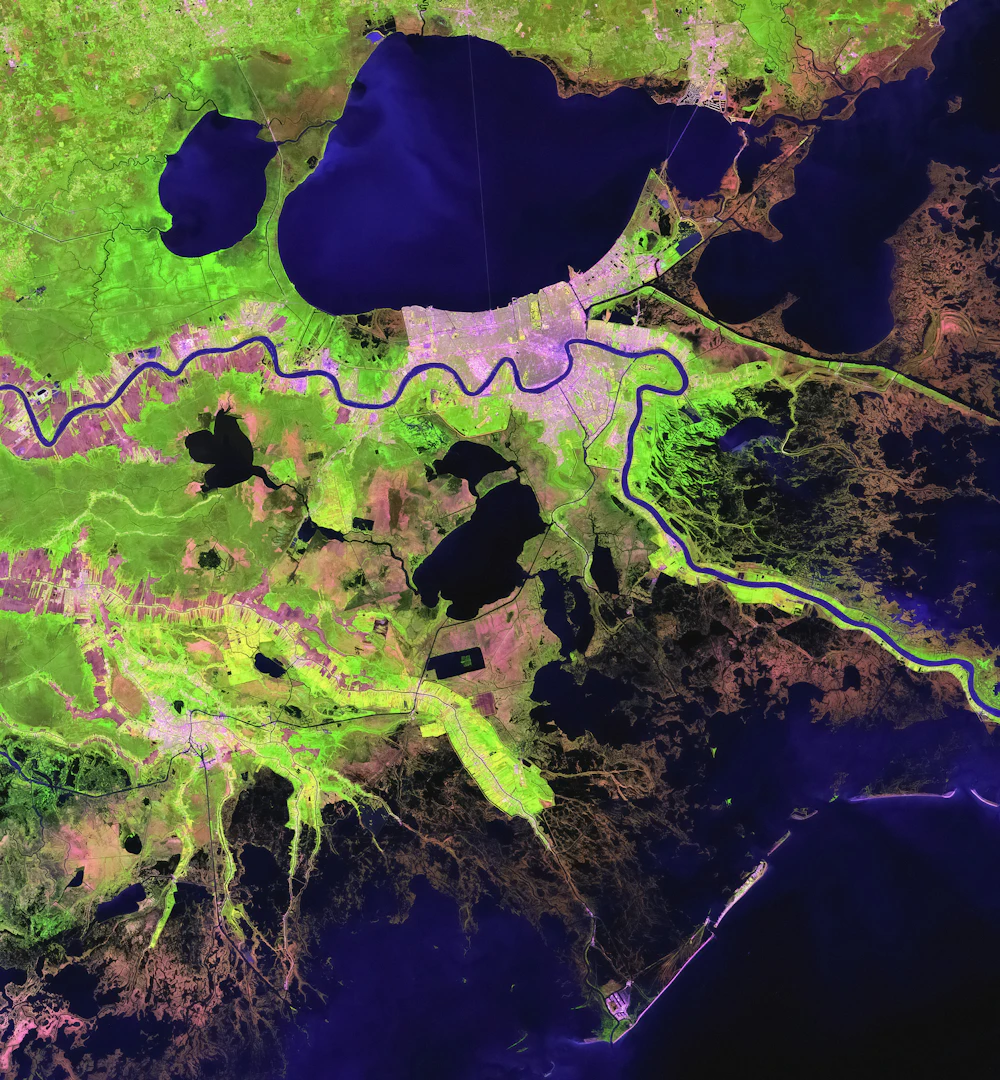
Sixty-four satellites image every square kilometre of land each day. Our models turn the pictures into answers: which fields flooded, which ports backed up, which roofs are new.
Landsat scene courtesy of USGS. Infrared and vegetation views are simulated from the visible bands for this preview.
Each Signal is a model that reads every new image of the places you care about and tells you when something changed, by how much, and since when.
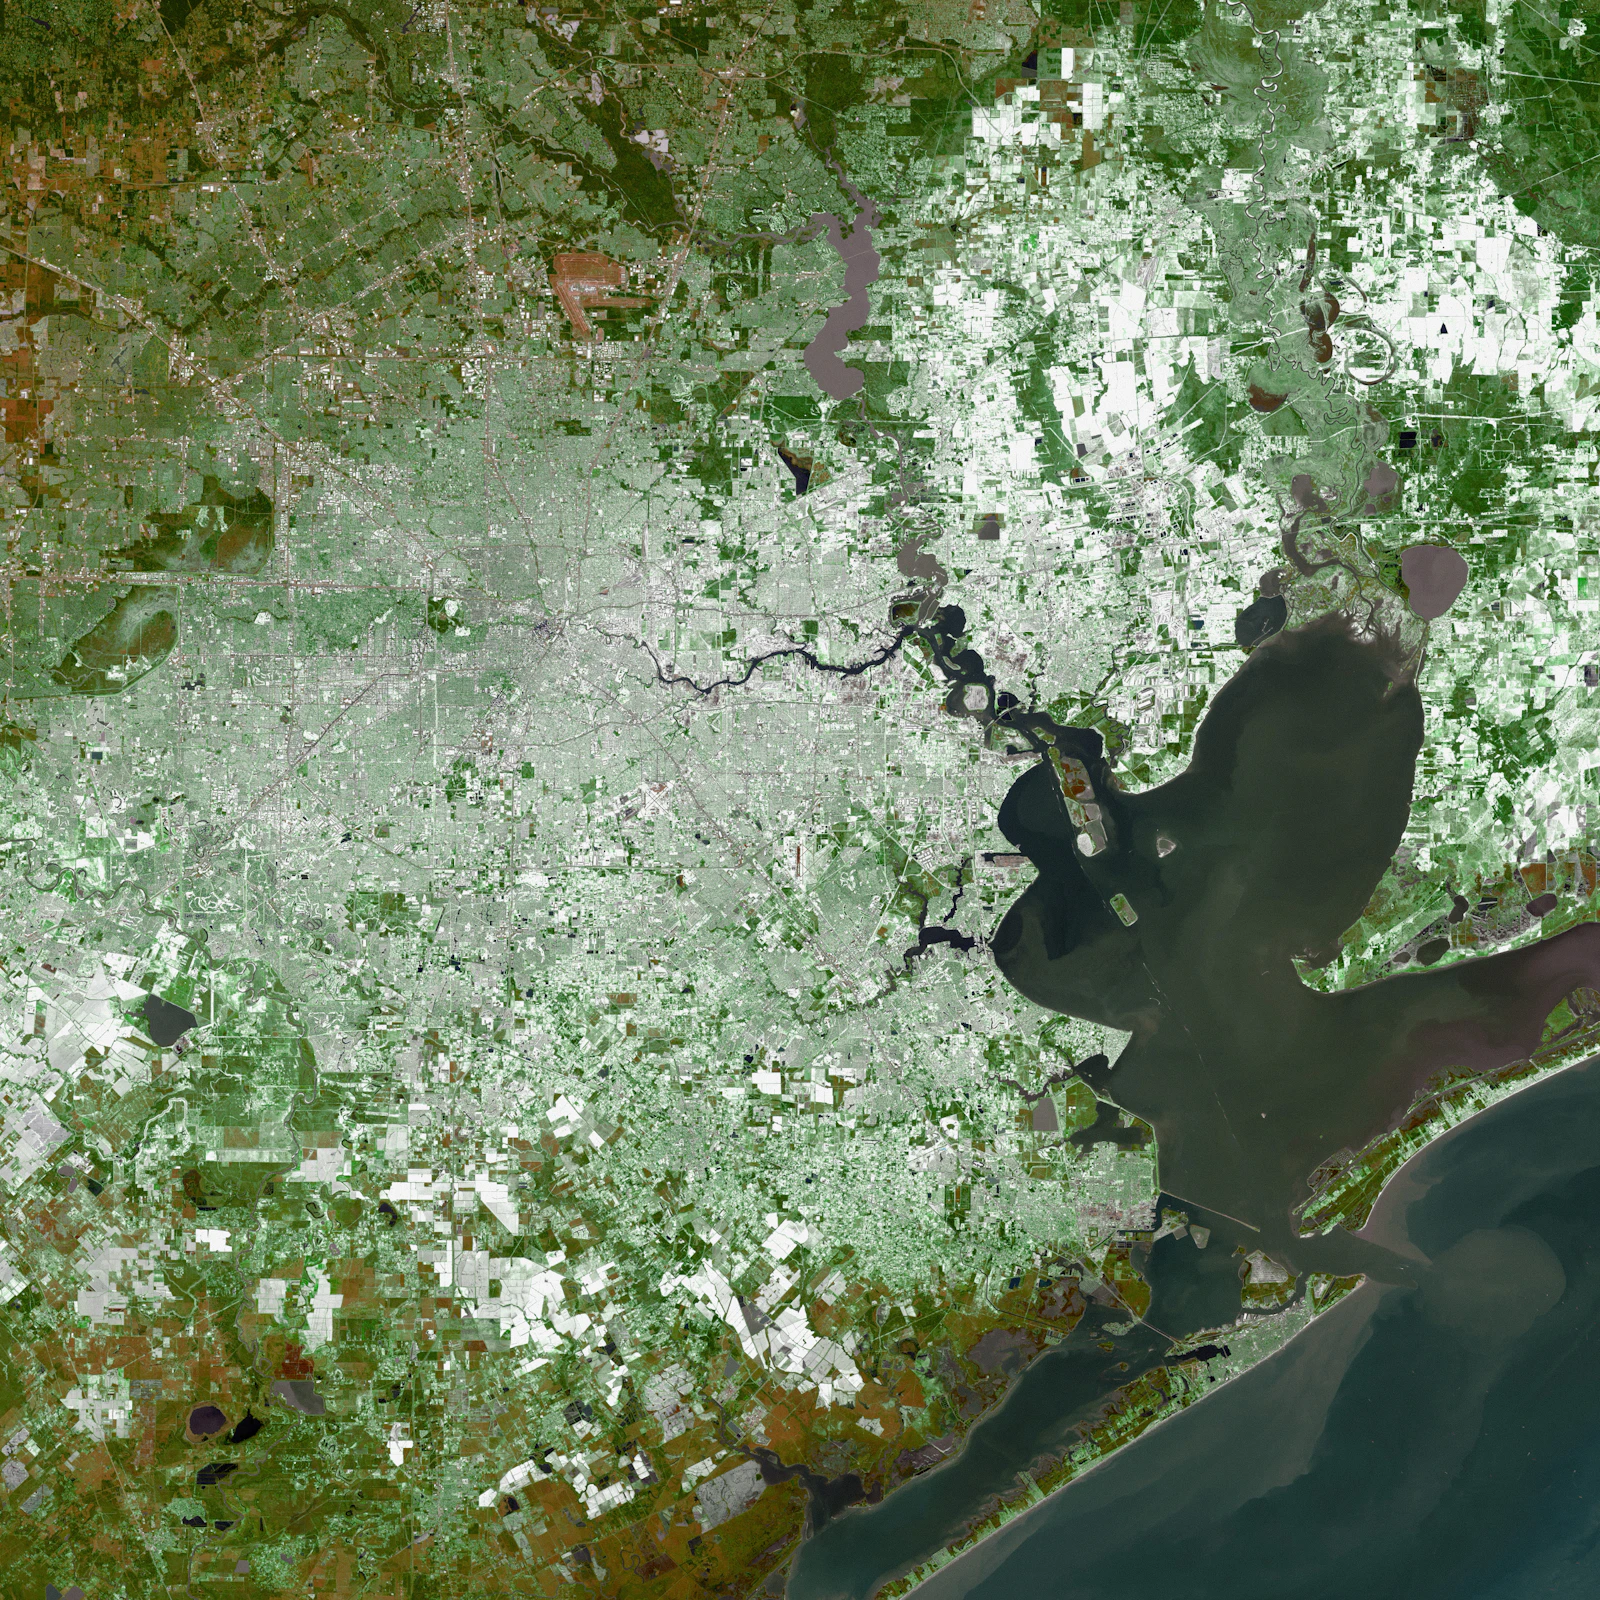
Water mapped through cloud using radar passes, compared with the dry-season baseline for every parcel in your portfolio.
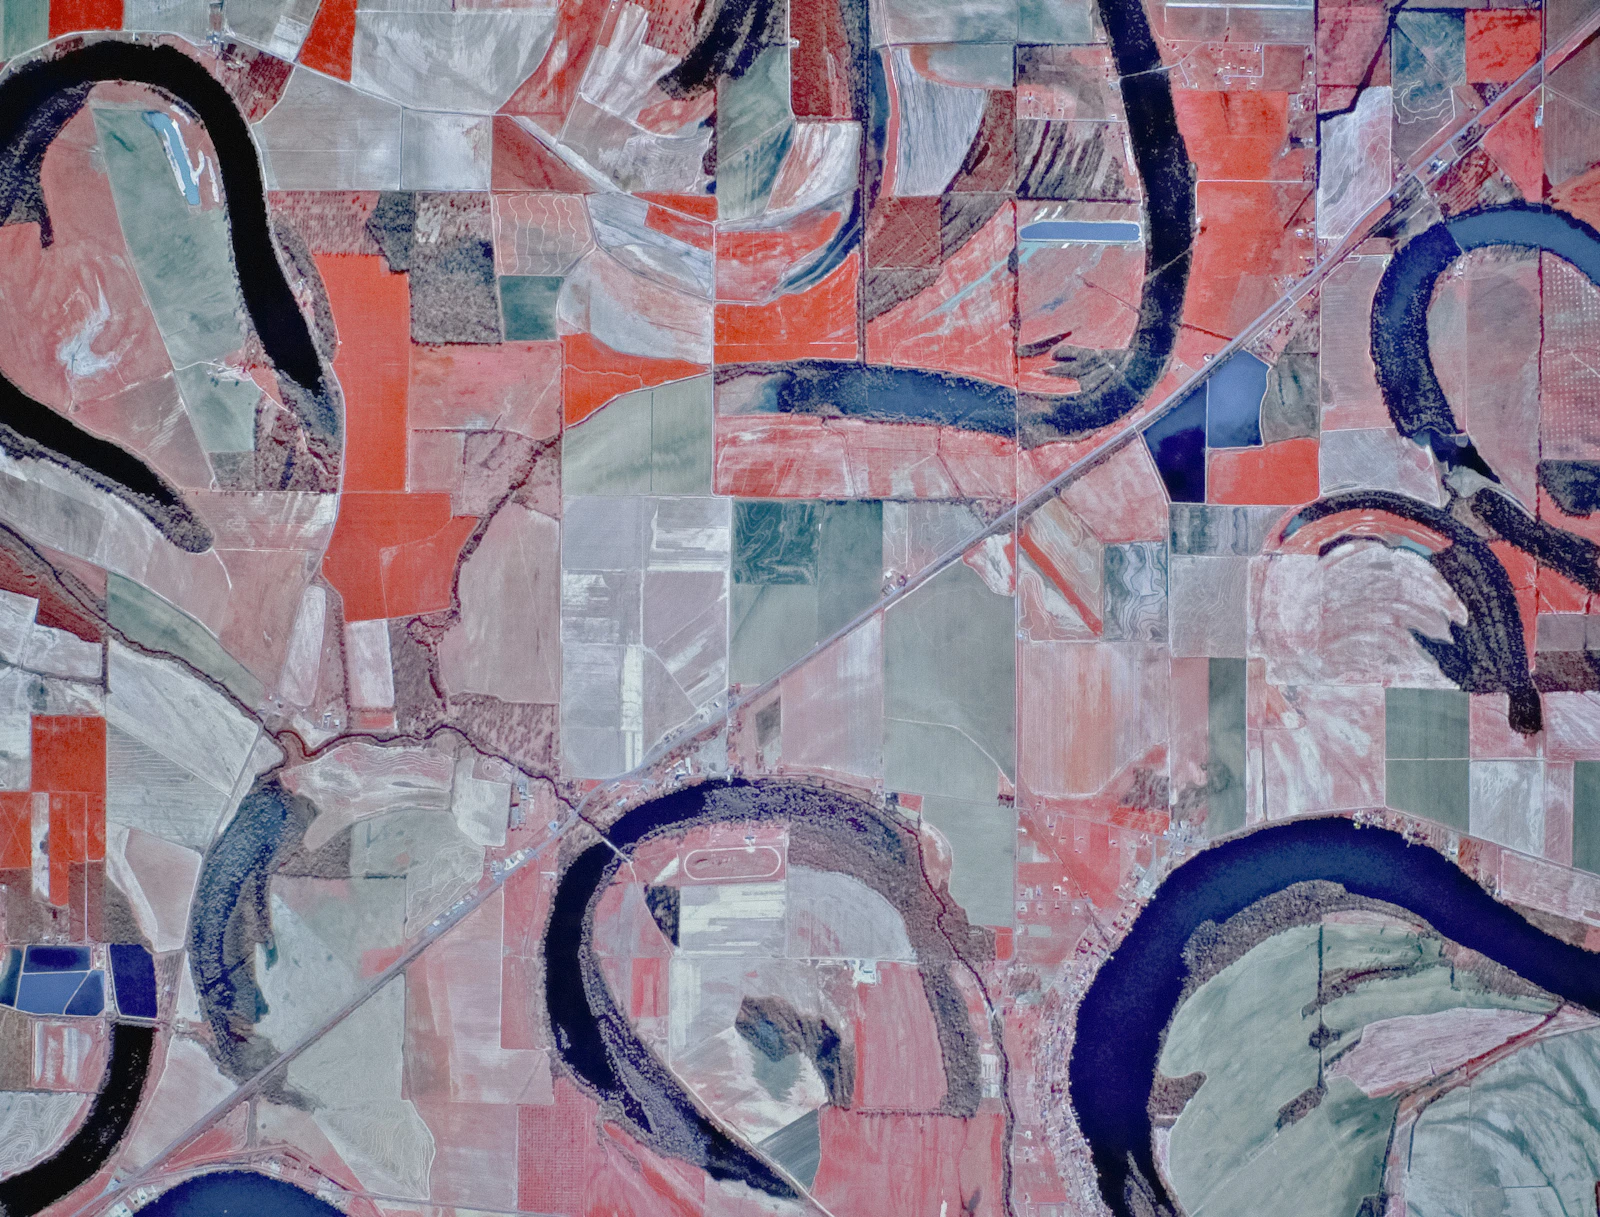
Vegetation health per field, every day, against that field’s own five-year curve. Agronomists see a problem a week before it shows from the road.
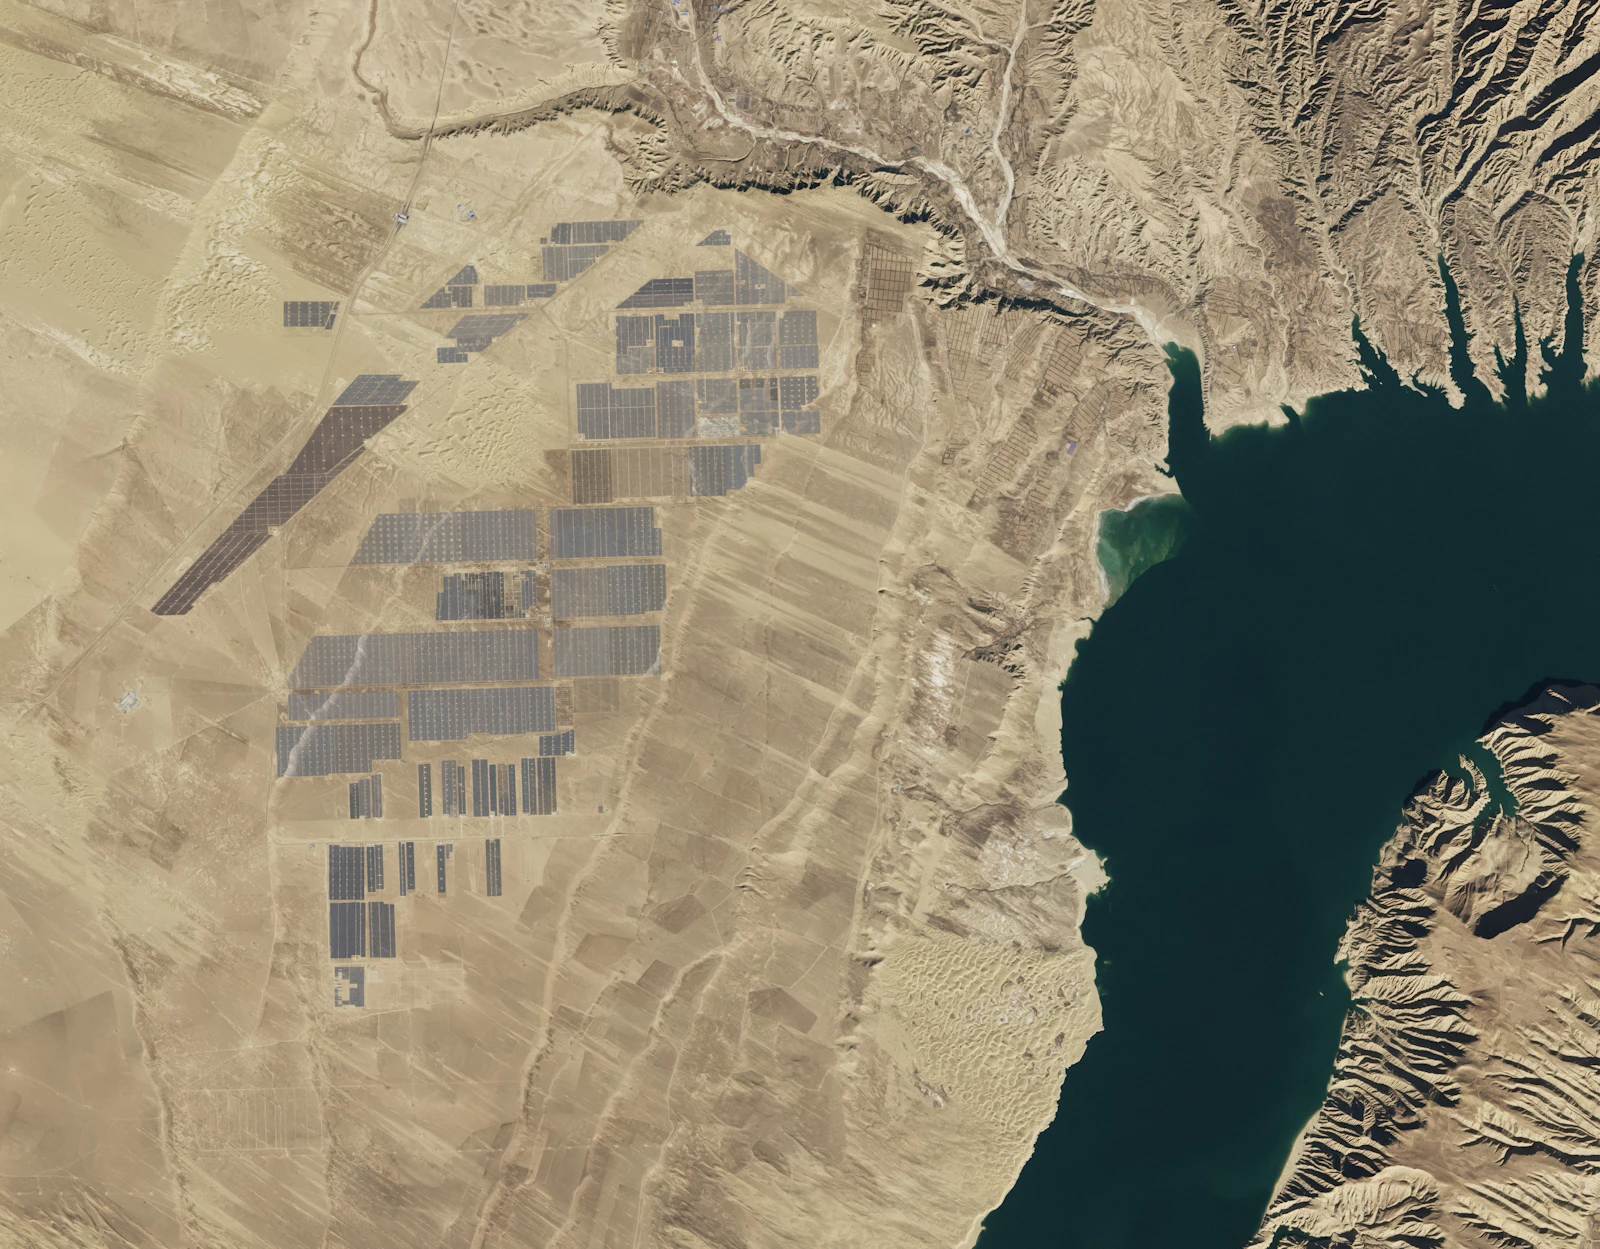
Footprints of new buildings, roads and solar arrays, dated to the week they appeared. Useful for permits, valuations and supply-chain checks.
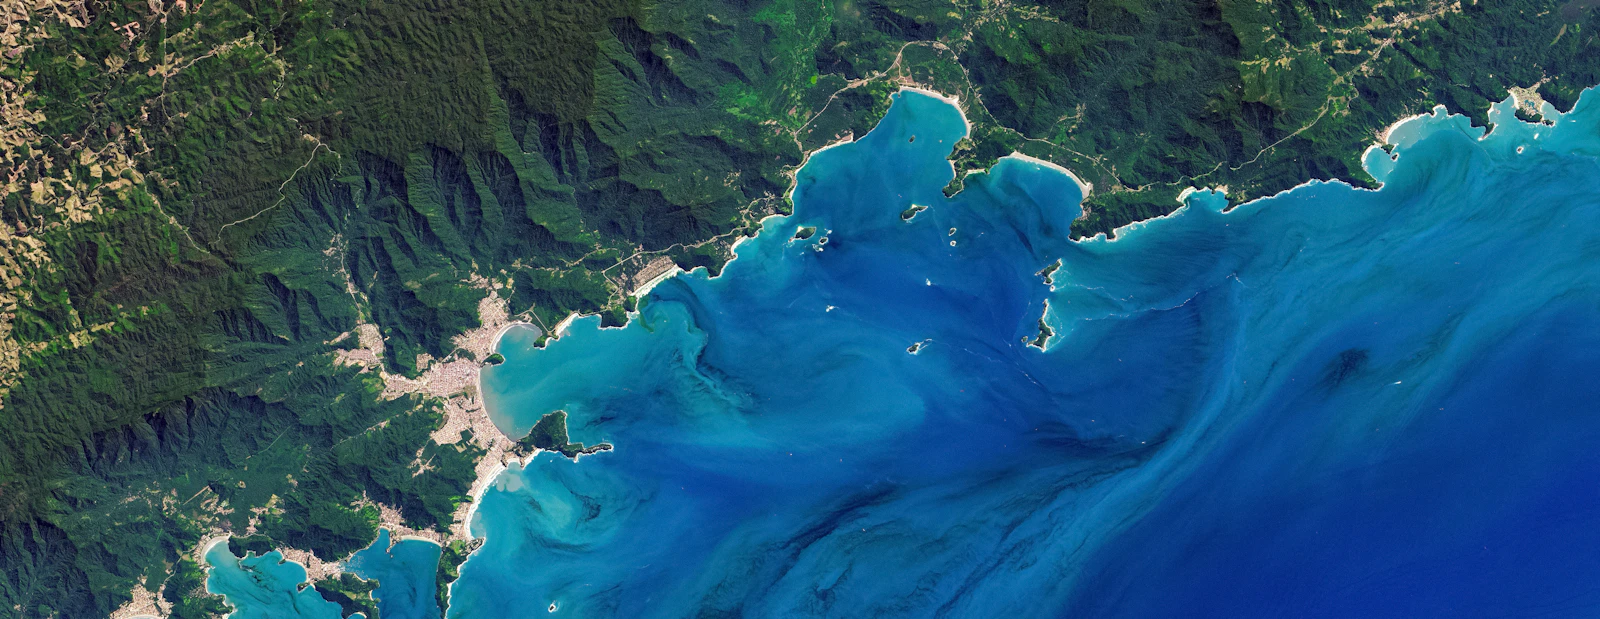
Where land meets water, measured at every pass and compared back to 2015. Erosion, dredging and land reclamation show up as a moving line.
Draw an area or send a GeoJSON. We return analysis-ready imagery, already corrected for atmosphere and terrain, and the Signals you subscribe to as plain JSON.
from nadir import Client

field = Client().aoi("fields/rio-verde-07.geojson")
scene = field.latest(cloud_max=0.1)
stress = field.signal("crop-stress", since="2026-09-01")Know which policies sit in the flood before the first claim is filed, and settle the straightforward ones without sending an adjuster.
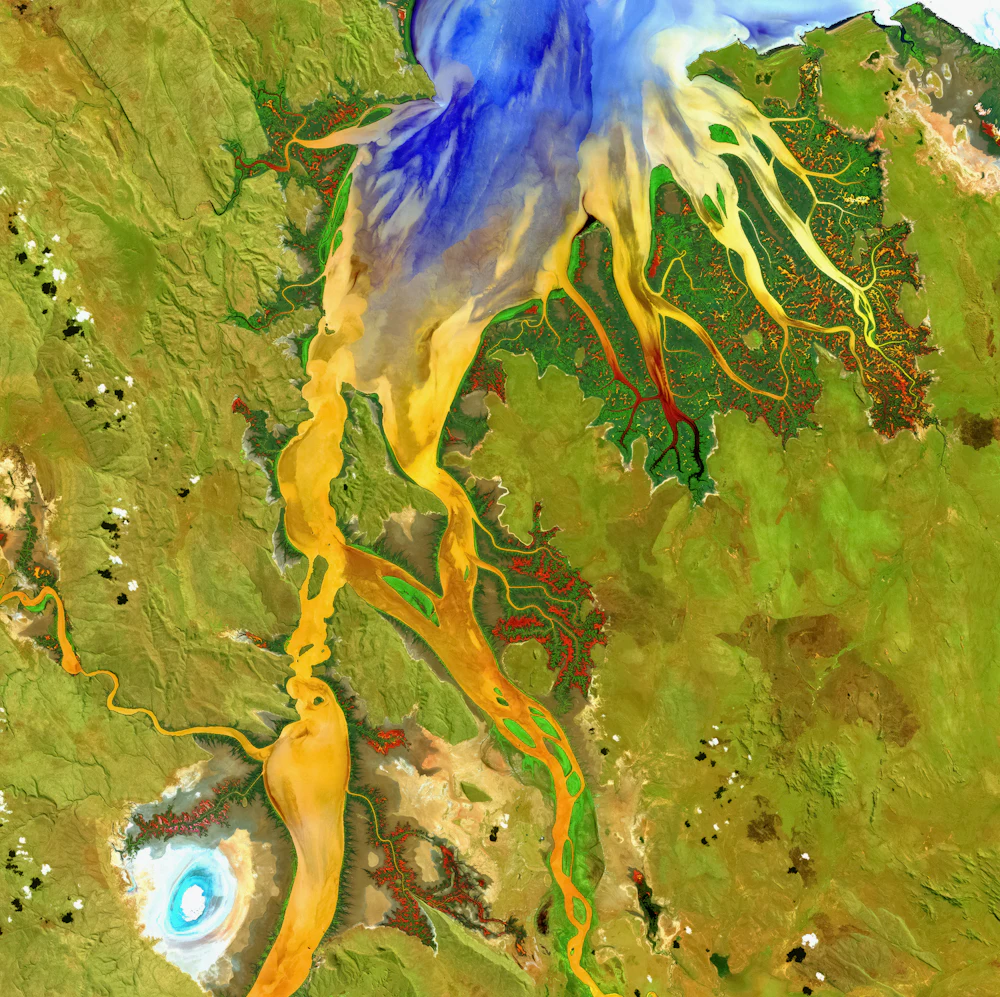
Per-field health and yield forecasts for lenders, input suppliers and growers with too many hectares to walk.
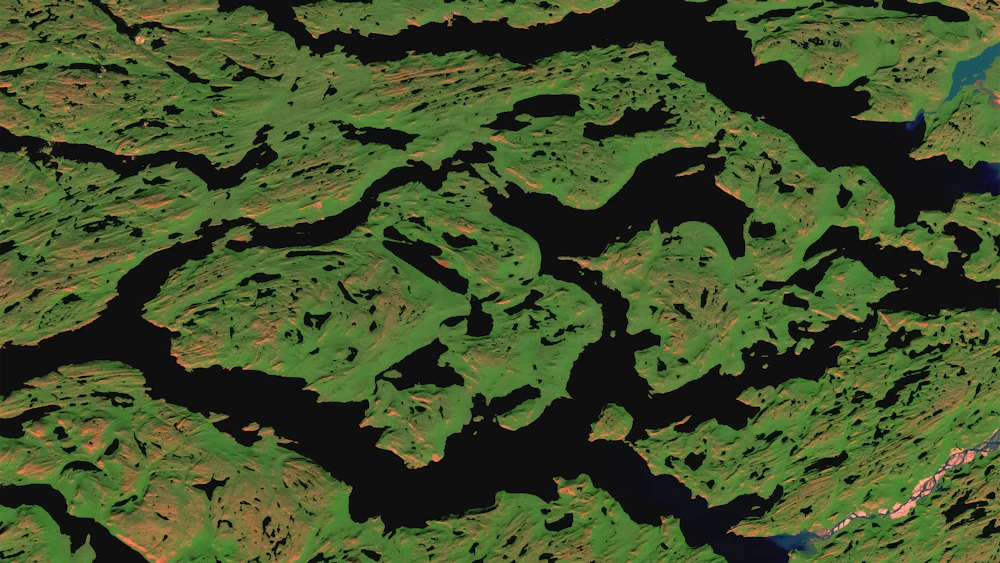
Ship counts at anchorages, tank farm fill levels and stockpile volumes, a day ahead of official numbers.

Deforestation alerts, sea-ice and shoreline monitoring, and disaster response maps within hours of a pass.
Every plan includes daily imagery of your areas, the full archive back to 2015 for them, and API access. Signals are added per area.
$0per month
$1,900per month
Customannual contract